Jacob Freedman's Portfolio
webpage portfolio for open source GIS work
Project maintained by jafreedman12 Hosted on GitHub Pages — Theme by mattgraham
RP-Kang
Original report and Replication Code: Kang et al. (2020)
Repository for replication found here
Changes created by Jacob Freedman, with support from GEOG323, especially:
- Maja Cannavo for her help creating the improved hospital catchment zones
- Sanjana Roy for helping change the color palette of the output maps
- Alitzel Villanueva for support in implementing the
%%timefunction into each code block
Introduction
This report by Kang et al. (2020) created a map of hospital catchment regions in Chicago, Illinois in response to the COVID-19 pandemic. Using data about vulnerable populations (Over 50 years old) and the spatial prevalence of COVID-19, these maps are intended to create best practices for the distribution of ventilators. By creating their code in an open-source format of a Jupyter Notebook, the authors have provided opportunities for outside researchers, such as ourselves, to replicate this study and explore possible iterations for other landscapes. While we continue to replicate this report in Chicago, Illinois, we contribute necessary changes for making this report applicable to other cities and regions.
Materials and Methods
The data used for this study was sourced directly from the primary study conducted by Kang et al. (2020). We used a hexagonal grid of polygons to model the city of Chicago and avoid significant edge effects in our catchment regions. Population data and zip code data was derived from Census data, the Chicago road network came from Open Street Map using the OSMnx Python downloader package, and hospital point data was collected from the Illinois Department of Public Health (IDPH). Cases of COVID patients at the time of study were provided by the IDPH, as well.
The primary changes I made to the code were changing the hospital regions to avoid border affects from hospitals connected to nodes on the border of Chicago. By extending the OSM road network buffer to 25km outside the city limits of Chicago, we ensured that hospitals outside the city remained in their actual location and were not ‘snapped’ to the border of Chicago. In the original code, these hospitals were forces to align with the boundaries of Chicago, creating border affects that impacted the rest of the analysis.
In terms of aesthetics, I changed the color of the output map to better reflect access to hospitals. Since the color ‘red’ is often deemed as an intense color that does not reflect access to a public good. By changing the color ramp from ‘OrRd’ to ‘Blues’, I hope to draw the attention of the reader to the beneficial nature of living near hospitals. I also added a ‘%%time’ function to the start of each code block to show the time it took to run each segment of the code.
I attempted to change the final output projections of the maps by shifting the projections of the hospital points. Because the points were inputted at hard-coded X/Y coordinates, I reprojected the hospitals to EPSG code 32616 and tried to force these geometry points into something that could be projected in the hospitals.plot function for the output map, as provided to us by Professor Joe Holler. The initial code listed this hospital plotting with the ax.scatter function, which forced the plotting to use the hard-coded geocoordinates in the output, which were in EPSG 4326 at time of input.
Results and Discussion include images of findings (maps, graphs) and link to your final repository for the reproduction. Discuss what you learned from the reproduction attempt, especially any knowledge, insight, or uncertainty that was encoded in the repository or discovered in the reproduction but not explained in the published paper.
This replication shows that the visual aesthetics of the map can influence interpretations of the hospital regions
Fig 1: Original Hospital Output (Kang et al. 2020)
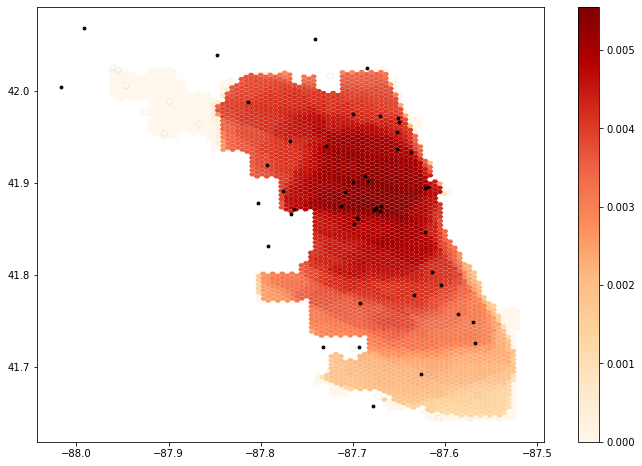
Fig 2: Chicago hospital catchments, EPSG 4326 (WGS 1984), changed color palette
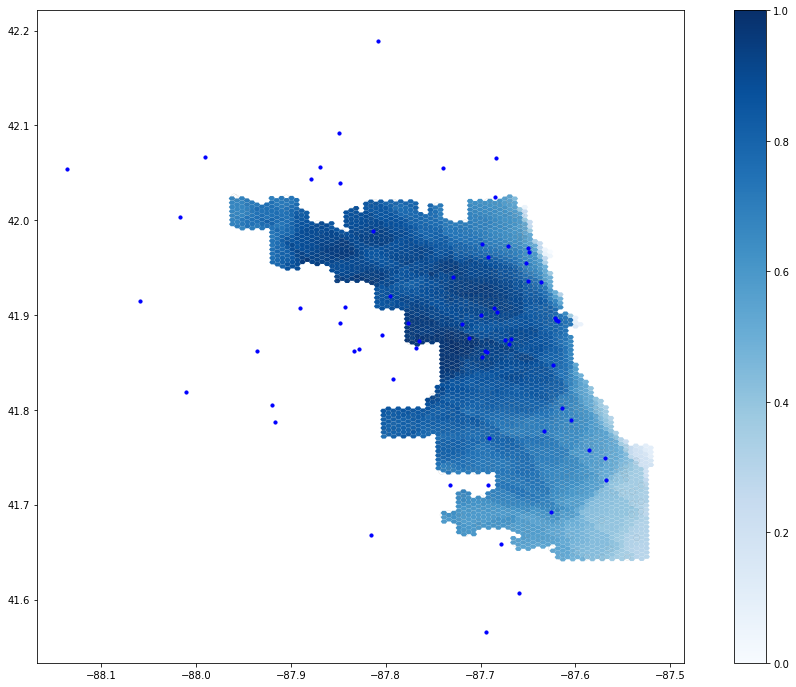
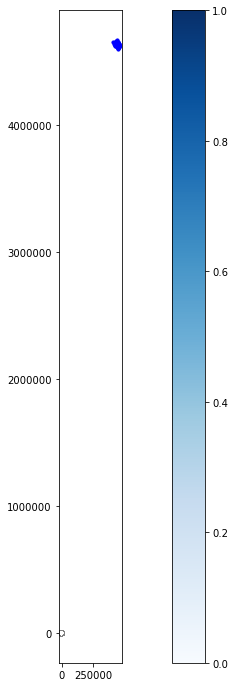
Fig 3: Chicago hospital catchments, EPSG 32616 (UTM 16 N) Unable to load this image, see fig. 4. Was unable to get polygons to shift to EPSG32616.
Fig 4: Visualization of primary errors with converting WGS1984 to UTM16N
Conclusions with emphasis on the significance of the reproduction study you just completed. Was the study reproducible, and has the reproduction study increased, decreased, or otherwise refined your belief in the validity of the original study? Conclude with any insights, priorities, or questions for future research.
By creating these changes to hospital boundary effects, projections of hospital points and the output map, and overall aesthetics of the project and code, I am contributing to making this study reproducible onto other landscapes in the future. Since the EPSG:4326 code is notoriously bad at representing the projection of any specific landscape, this opportunity to use other projections is integral to making effective maps in additional cities.
The CyberGISX helped with the replicability of this study by providing a ready-to-use platform for experimenting with and altering the data. Similar studies claiming to enhance the replicability and reproducibility of open source GIScience (see our replication of Malcomb et al. (2014) study of climate vulnerability in Malawi) were far more challenging to replicate without open-source code documenting the thought process of the researchers. Future work in the field of scientific replicability could have greater code documentation and explanations in each code block, making the decision-making process and possible solutions more transparent to readers. This step towards open-source code with the Jupyter Notebook and CyberGISX is important and much-needed in creating replicable code for future analyses.
Works cited:
- Kang, J. Y., A. Michels, F. Lyu, Shaohua Wang, N. Agbodo, V. L. Freeman, and Shaowen Wang. 2020. Rapidly measuring spatial accessibility of COVID-19 healthcare resources: a case study of Illinois, USA. International Journal of Health Geographics 19 (1):1–17. DOI:10.1186/s12942-020-00229-x.