Jacob Freedman's Portfolio
webpage portfolio for open source GIS work
Project maintained by jafreedman12 Hosted on GitHub Pages — Theme by mattgraham
Error and Uncertainty in GIS
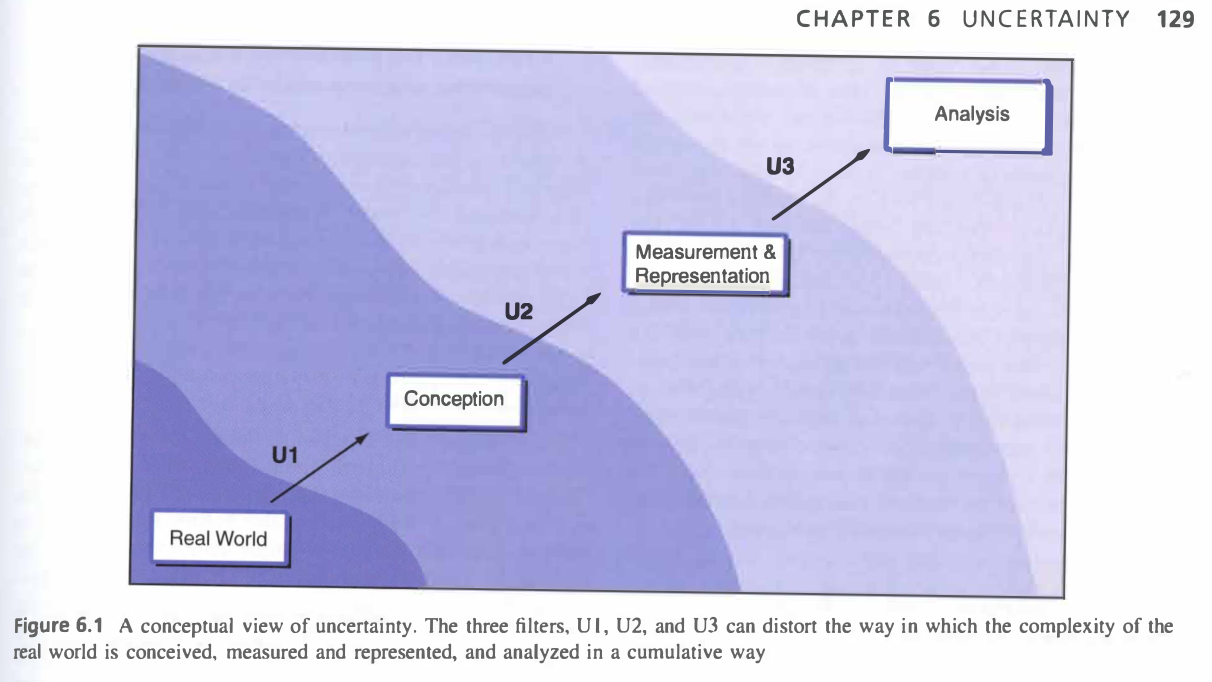
The ways in which space is represented are never complete. It is impossible to make an accurate representation of the world, as you can never tell every story of every place with one map. In GIS, there is uncertainty with data accuracy and precision, from how ecosystem boundaries are represented as firm lines (even though these boundaries are fuzzy) to accuracy with tools (remote sensing imagery, GPS), to which stories are told. There is a common misconception that maps are an objective view of the world. In fact, data analysts and map makers are often forced to make subjective assumptions based on the constraints of GIS and output maps. In figure 6.1 in Longley et al. (2008), geographer Gerard Huevelink illustrates how our representations of reality (e.g. maps) are actually massive distortions of reality, as data processing, analysis, and publication shifts the original intent of the map. I’d go one step further to say this is a cycle, as our perceptions of the world around us are shaped by maps and representations we’ve seen before. Maps from the past influence how we perceive the world today, which are further distorted by maps we make today that go through many iterations of processing.
Longley et al. (2008). Figure 6.1. Created by Gerard Hueveling

First-hand knowledge with uncertaininty in spatial research
Through my senior thesis, I am researching inclusive mapping in the field of environmental conservation. A big issue with maps is that they are taken to be a completely factual representation of a place, and cartographers do little to dissuade these assumptions. There are many scenarios where the quality of data is inadvertantly (or intentionally) obscured, making it challenging for future generations to understand the legitimacy of the data. Be it vagueness in plottable data (aggregation of point features, fuzzy boundaries made firm, hidden histograms for choropleth maps, etc.) to innacurate units of analysis, to automations of spatial representations that are not accurately field tested, there are lots of opportunities for distortion in spatial analyses. For many cultures, representations of space and relationships cannot always be shown in a 2D, grid-coordinate based way. There are many relationships and units that go beyond the spatially plottable.
In doing research with Professor Jessica L’Roe, much of our data about field research in East Africa comes from hand-written notes that are digitized and geocoded. Creating “accurate” spatial data requires many steps – field assistants interviewing local community members, photocopying these paper notes, sending .pdfs through WhatsApp, digitizing these notes into a usable CSV file, and validating these data with GPS points for each surveyed household. This spatial is then re-transmitted as maps to field researchers for validation, inevitably leading to re-evaluating and processing of data. Add in language translation (at times), and there are many minds that this data has to go through before use in GIS. I know first-hand how much uncertainty there can be in spatial data and how much energy is required to validate these uncertainties.
What responsibilties do geographers have with regards to uncertainty in research? What strategies might geographers use to fulfill those responsibilities?
I believe that geographers have the responsibility to do a deeper investigation into the accuracy and origins of data sources. For example, as suggested in the reading, there’s a general assumption that maps are accuracte to 0.5mm at the scale of map, but this does not always mean a point is where it should be. As scale of map increases (1:100 –> 1:10000000), that 0.5mm accuracy means something different. The map may be off by 0.5m on the ground at a 1:100 scale, but off by 5000m in the 1:10000000 scale. In terms of data validation, some specific tools geographers can use are spatial autocorrelation to assess the relationships of errors between pixels, confusion matrices for ground truthing, and testing the accuracy and precision of all our tools (e.g. GPS). As geographic analyses often make the data origin and representation fuzzy, it is the role of the geographer to put data disclaimers into their work and explain why we make the choices we do. By openly acknowledging uncertainty in data (instead of hiding behind a shroud that all data is accurate), we can more deeply investigate the validity of our research and build a more open, collaborative working environment.
Works cited:
- NASEM. 2019. Reproducibility and Replicability in Science. Washington, D.C.: National Academies Press. https://www.nap.edu/catalog/25303.
- Longley, P. A., M. F. Goodchild, D. J. Maguire, and D. W. Rhind. 2008. Geographical information systems and science 2nd ed. Chichester: Wiley. (only chapter 6: Uncertainty, pages 127-153)
- Research and conversations with J. L’Roe, M. Schnure, M. Pearce, J. Howarth, D. Suarez, T. Affolter, M. Lapin