Jacob Freedman's Portfolio
webpage portfolio for open source GIS work
Project maintained by jafreedman12 Hosted on GitHub Pages — Theme by mattgraham
Gravity Model of Spatial Interaction
The purpose of these two models is to create hospital service zones in line with those created by researchers at the Dartmouth Institute for Health Policy and Clinical Practice. The model for preprocessing hospital data consolidates the number of beds from hospitals in a given zip code into one, central point for the zip code. The simplified distance matrix creates hospital service zones based on the friction of distance between the centralized hospital points and surrounding towns. Each hospital cachement zone is constructed of the towns have the highest potential to go to that hospital. You can view the final map here.
These models can be viewed here:
Hospital Preprocessing Model
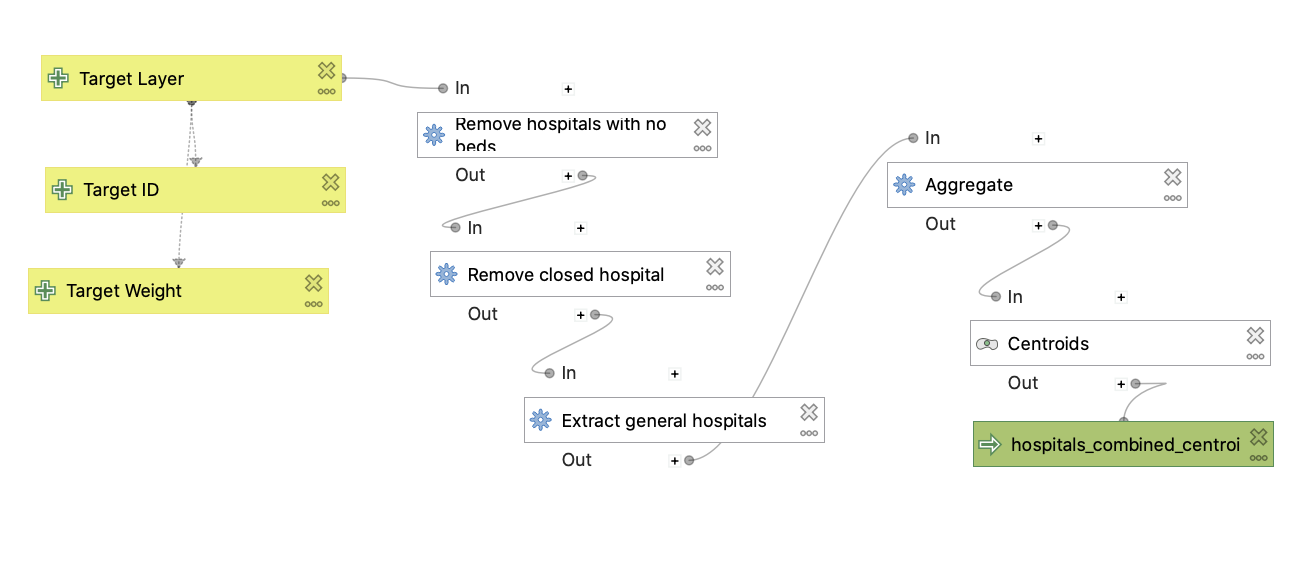
The hospital points from the U.S. Department of Homeland Security were processed to only include hospitals servicing the widest proportion of people (Critical Access, Long Term Care, General Acute Care, Children, Women). This excludes psychiatric, military, and rehabilitation hospitals. All hospitals that have zero beds or are closed are excluded from this analysis. The hospitals are aggregated by zip code and the number of beds from all hospitals in the given zip code are summarized.
Simplified Distance Matrix
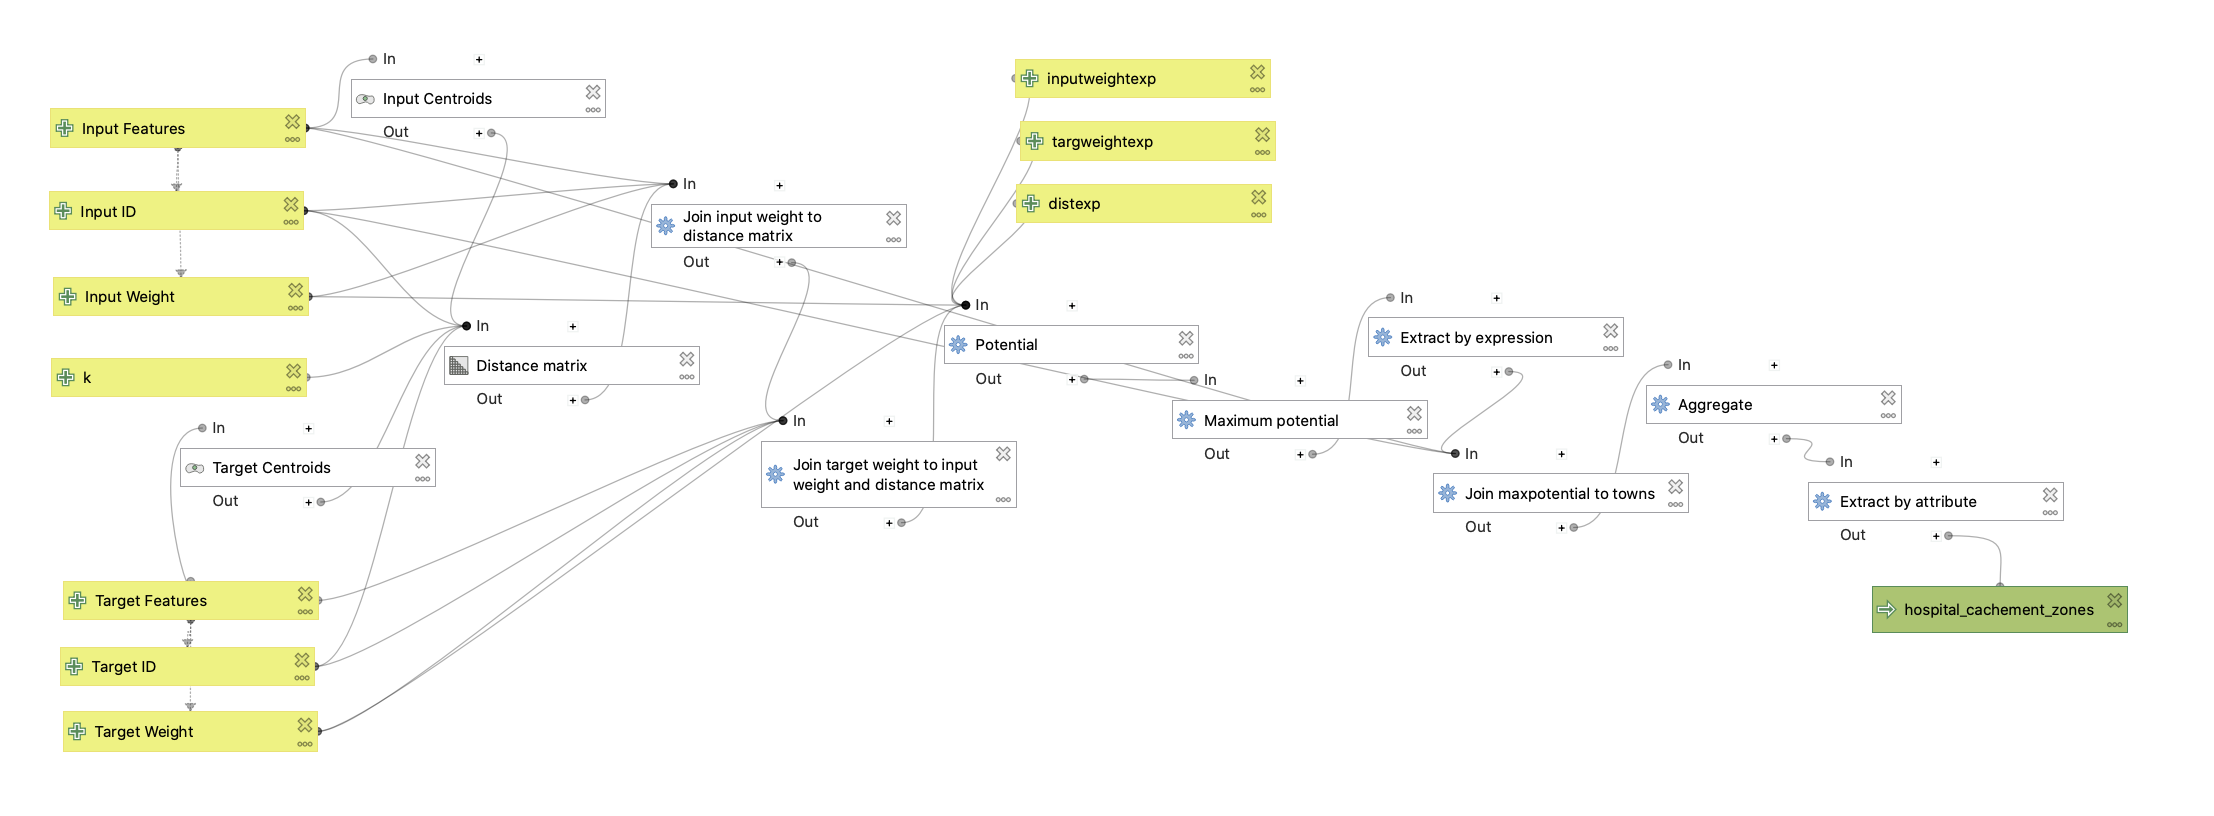
This model takes the simplified hospital points (as created above) and town boundaries with population data as gathered from the ACS 2018 5-year average. By creating a distance matrix of the hospitals and nearest 20 towns, the potential for visitation is calculated with the weight from number of beds (in hospitals) and population (in each town). The service regions are the aggregations of towns that have the highest potential to visit a given hospital/hospital zip code region.
Analysis
When our model is compared to the service regions given by the Dartmouth Health Atlas, there are some apparent discrepancies. Our hospital preprocessing model constructs the centroid of all the hospitals in the given area (zip codes here) and assigns the number of beds of all hospitals in the zip code to the central point. This creates some inaccurate hospital service regions, as these zip codes can be very spatially close to one another and do not reflect local patterns of roads and access to certain hospitals. Our analysis does not exclude bodies of water, implying that the friction for travel over lakes, oceans, and rivers is equal to friction of travel over land.
The Dartmouth Cachement Zones were created with real population data, and the exact zip codes were assigned to the hospital where most people in the zip code region were seeking care. This was not created with a GIS model, but reflects actual patterns of behavior exhibited by people visiting these hospitals. Based on these groud truths, it is possible that certain hospitals are weighted more highly not just by the number of beds but also the services they can provide. For example, hospitals that have the capacity to handle higher levels of trauma generally have more beds, though this is not always the case with specialized hospitals.
Data sources (and collaboration!):
- The town boundaries and population data for this analysis was retrieved from the ACS 2018 5-year average.
- Hospital points were retrieved from the U.S. Department of Homeland Security.
- Hospital Service Area boundaries were gathered from the Dartmouth Atlas of Healthcare website, using HSA zones.
- Additional credit is given to the participants and instructors of the GEOG0323 - Open Source GISciences course at Middlebury College (Spring, 2021). Without their help, none of this modeling would have been possible.